March Slide Makeover of the Month

March 30, 2012

This month’s slide comes from Design Dispatch subscriber Bob Carpenter of BidRx. His company wants to become the eBay or the Priceline of the pharmaceutical business. By logging on to BidRx, people will be able to get competitive pricing on their prescription medicine and save a bundle in the process!

Before

BidRx slide: before

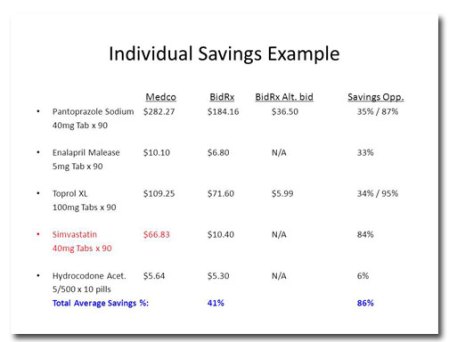
There are some pretty compelling data in this table to support Bob’s assertion that people will save money by using BidRx, but this layout makes it hard to find. Tables are usually a bad idea to show an audience because with so much to analyze you lose people’s attention.

There’s a lot of extra information in this table. Showing the prices down to the penny might be accurate, but it clutters the table and doesn’t help to show the overall trend that BidRx’s prices are lower than Medco’s. And is it important for people to know the exact dosages of each medicine?

The biggest takeaway from this slide is that consumers stand to save up to 86% on this prescription. That’s a huge discount and is the key value proposition. So why is it so tiny and at the very bottom of the slide?

After

BidRx slide: after 1

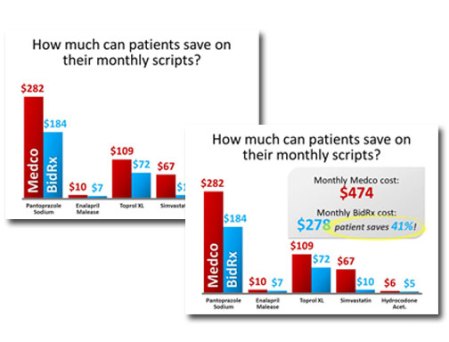
The first thing I did was to change the title of the slide. I like to think of slide titles as headlines, so they should be attention-grabbing and interesting. Next, I presented the data as a column chart, which makes it easy to compare Medco’s prices against BidRx’s.

The color choices I made are deliberate. In a financial setting, red = bad, so I’ve set up Medco as the “bad guy.” The BidRx columns are blue, a soothing color associated with health care.

The second image is what the slide looks like after the animation. I don’t want to leave it to chance that the audience will understand that BidRx’s prices are lower, so I tell them and I circle the amount people will save.
Next, I created a second slide to call out the even greater savings that could result from a competitive bidding situation:

BidRx slide: after 2

I copied the chart from the previous slide, then animate the bars going down on two of the medicines and point out the lower prices with green arrows. Then the same summary box appears.
Want to get your own slide makeover? Design Dispatch subscribers each receive a free slide makeover, a $100 value! The Design Dispatch is your monthly guide to great PowerPoint.

Sign up for the Design Dispatch today!


Are you a PowerPoint Ranger? Be proud!

March 28, 2012

Poor PowerPowerPoint patches of honorPoint. This stalwart workhorse has been around for over two decades, supporting business presentations and facilitating communication for millions of people. But are they grateful? No, quite the contrary! You have people all over Twitter complaining about Death by PowerPoint and a snarky business owner who specializes in Cheating Death by PowerPoint (that would be me).

In the armed forces, it’s considered an insult to be called a PowerPoint Ranger, the military equivalent of a police officer being called a Desk Jockey. How does one hold one’s head up high in the face of such mockery? Why, by wearing that insult as a badge of honor, of course! And Jim Placke makes it possible.

Jim Placke’s NBC Links is a website devoted to “providing easy access to information related to chemical, biological, radiological, and nuclear (CBRN) warfare, defense, and domestic preparedness.” Though the site design harkens back to an earlier time, it is a current, exhaustive listing of sites from all over the world.
But Mr. Placke isn’t all about business; he’s got a great sense of humor. Hidden among the hundreds of links is the one I want you to know about:

Click here for PowerPoint patches

Here’s where the magic happens.

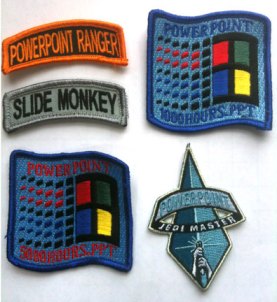
From “PowerPoint Ranger” and “Slide Monkey” tabs to patches proclaiming your hours of PowerPoint service, there is something for every PowerPoint afficionado(a) on your gift list.

Don’t be put off by the old-school site design and ordering methods — this is for real! I ordered the patches seen in the above photo and received them within a week.

If you or someone you know is a beaten-down Slide Monkey, reward all of that hard work with one of these fine patches!


February Slide Makeover of the Month

February 16, 2012

With February comes Valentine’s Day so I thought I’d draw inspiration from William Shakespeare to address a common problem in slide layout: How do you format a quotation?

Before

Valentine's Day before

Snore.

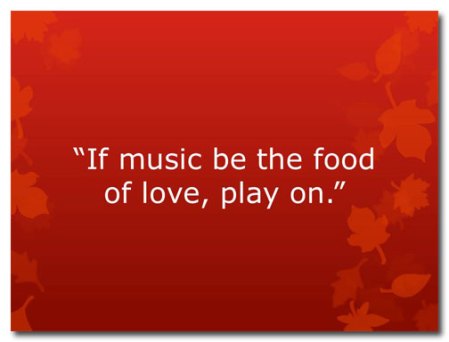
Apart from the pleasant background color and graphics, this quotation is about as florid as a wet dishrag. This font, Verdana, works well when you’re after a clean, corporate look, but it’s a total flop when used for this particular quotation. I think that this slide could really benefit from a picture, don’t you?

After

Valentine's Day after 1

Now we’re talkin’!

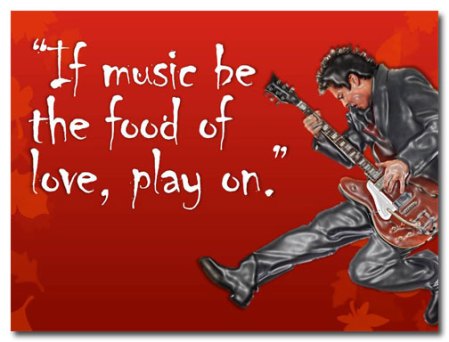
The addition of the violin and sheet music evoke feelings of romance and beauty and speak directly to the words in the quotation. I’ve also used a more playful font.

Look how I can change the mood by using a different image and font:

Valentine's Day after 2

It’s not likely that you’ll have to illustrate Shakespeare any time soon, but you can use these ideas the next time you include quotes in your presentations. You could use a picture of the person you’re quoting or images suggested by the quote. And play around with how the type is positioned; for this style you want to break away from the template, if just for a little while.


How do you show bad news in PowerPoint?

February 15, 2012

Sometimes it’s necessary to tell your audience something that’s not so great. Most presenters really don’t want to be the Bad Guy, but it’s important that their audiences have all the facts about what’s going on, whether it’s an underperforming fund, a bad quarter, negative ratings, or flagging sales. If people don’t know what’s wrong, it’s hard to develop a plan to fix the problem.

But you don’t want the whole presentation to be a downer, so you need to temper the bad news with some good news:

“Yes, sales are down 4% this quarter, but we have hired a sales mentor who is working with our team to bring their numbers back up.”

“We received some negative feedback on Twitter about our widget, so we contacted every unsatisfied customer and fixed their problems.”

“Fund X did not perform to expectations, so we are diversifying our holdings.”

You should address bad news but you don’t have to lead with it. Here’s what I mean.

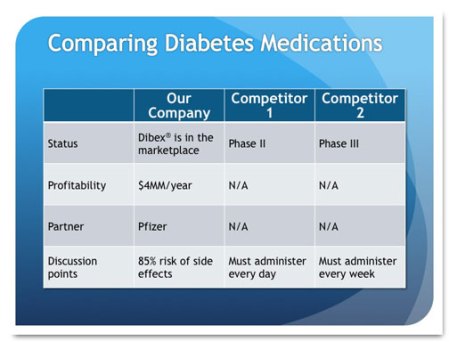
I recently met with a medical product client who showed me his “Pitch Deck,” the presentation he gives to venture capital firms and other groups when he seeks funding for his company. One slide showed a table that compared their company’s product against similar products being developed by two competitors. My client had a lot of great things going for him:

  • His company already had products in the marketplace
  • These products were making money
  • They had big-name partners

This product also had a slight problem: it causes a medical condition in 85% of its users.

The slide looked a bit like this (The data have been changed to protect proprietary information.):

Medical product slide before

I asked him about it, and he said that it is a common side effect for this kind of medication and that it is easily treated during outpatient surgery with great results. So the story he’s trying to tell is Great News, Great News, Great News, No Big Deal. But when I look at this table as a member of the audience might, I see this story: Great News, Great News, Great News, Slam-on-the-Brakes Major Problem!!!

While it’s important for investors to have all the facts, it’s crazy to present the data in a table that doesn’t stress the positive and provides any relief for the negative.

Here’s how I would redesign this slide:

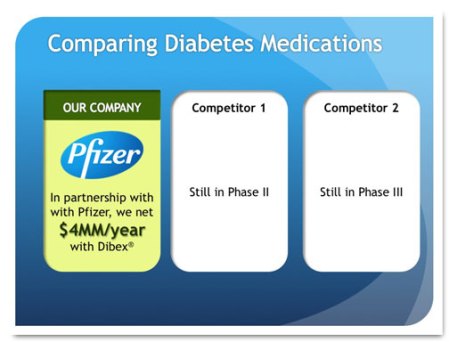
Medical product slide: Great News!

This slide focuses on the positive by including a well-known partner logo, making the yearly profits stand out with large type, and showing the product name, which has been trademarked and is on the market. The first panel is green, which implies “go” and “cash,” and the competitors’ panels are drab by comparison. Look at how they lag behind! Who wouldn’t want to fund this guy?

But it would be unethical to withhold the bad news, so here it is:

Medica product bad news

Here, I’ve emphasized the fact that the side effect won’t kill patients and can be corrected fairly easily. The presenter would discuss the side effect and its treatment in greater detail when he’s in front of the audience.

Your Turn

Have you ever had to give bad news during a presentation? How did you do it and how was it received?


January Slide Makeover of the Month

February 1, 2012

This month’s slide was adapted from a real presentation I worked on in December. So as not to reveal proprietary information, the data have been changed but the slide layout is essentially the same.

Before

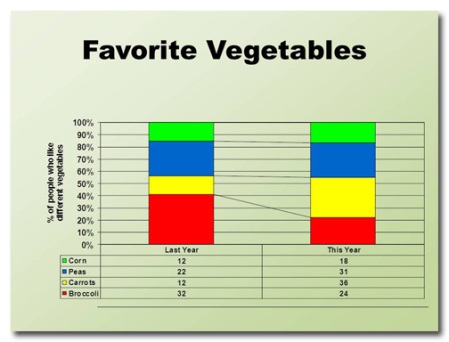
Favorite veg table slide: before

This slide took me a little while to figure out. I can tell that the four data points are supposed to add up to 100% and that they have changed from last year to this year. And I know that the diagonal lines that connect data points indicate whether percentages have increased or decreased from one year to the next. But what’s up with the table underneath the graph?

If there are two different types of charts the assumption is that there are two different data sets. In this case, however, the two charts present the same data. It took me a while to figure this out, and I didn’t even have a presenter talking to me at the same time. Imagine what the audience would be going through.

The color choices are not good because they are too bright and don’t harmonize with the background. It’s the default color set, and it shows.

Adding to the confusion are the grid lines and the vertical title at right.

All in all, this slide requires way too much work on the part of the audience to figure out what’s going on.

After

Favorite Veg chart: after 1

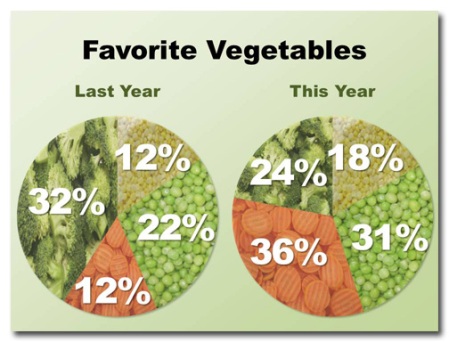
A pie chart is a much better way to show how percentages add up to 100%. Because it’s easy to see what wedges have gotten larger or smaller I have eliminated the comparison lines.

Notice the colors I’ve chosen? These are the colors of the vegetables in question. Not all data lends itself so well to obvious color choices, though, so when in doubt use the palette that comes with the template you’re using.

Because I have added titles to the wedges there’s no longer any need for a legend. I’ve also removed the vertical text because it was completely redundant.

But what if you wanted to reduce the text even further? In this case, using photographs as fills is a great solution:

Favorite Veg chart: after 2

Now it’s obvious which vegetables are being charted!


PowerPoint vs. Prezi: Which is better?

January 17, 2012

PowerPoint vs. PreziThroughout history, there have been many great rivalries: Red Sox vs. Yankees, Coke vs. Pepsi, Mac vs. PC. In the battle for the hearts and minds of the presentation community, perhaps there is no greater clash than PowerPoint vs. Prezi.

Up-and-comer Prezi brings its A-game to the fight. It’s nimble and dynamic. You can do lots of cool presentation effects with it. Your presentation lives in The Cloud. You don’t need to buy any software. It isn’t PowerPoint.

Grizzled veteran PowerPoint is putting up quite a fight, though. With its robust animation and multimedia tools, it’s possible to create presentations that look like movies. It has some great drawing and photo manipulation tools. You can output decks as video files or, using a site like Brainshark, create standalone presentations with sound and animation.

Is it possible to create dynamic, kinetic presentations in PowerPoint? Absolutely.

And here are two examples of some killer Prezi shows:

PowerPoint and Prezi do have something in common, though. You have to approach each project with a solid foundation, whether it be an outline, a storyboard, or a script. With all of the whiz-bang effects that each tool offers, it’s easy to focus on the medium rather than the message, which is absolutely the wrong approach. Sometimes Prezi shows move so much I have to shut my eyes to keep from getting motion sick. And if I have to sit through another PowerPoint deck that uses Bounce animation to bring in bullet points…

So, which is better, PowerPoint or Prezi? It’s simple: the better product is the one you’re most comfortable using and which helps you to be a better communicator. If you’re used to PowerPoint and can use it to create strong presentations, then PowerPoint is better. If the bold swoops, zooms and pans that are the hallmark of a Prezi show drive home your message, then Prezi is better.

Keep your eyes on the prize — audience engagement and acceptance of your message. Don’t get carried away with needless special effects and make sure your message is the most important thing that audiences get from your presentations. That’s the knockout punch.


Ready, Fire, Aim! The wrong way to design a PowerPoint deck

January 10, 2012

missed targetI once got a call from a woman who wanted some PowerPoint advice. She said something along the lines of, “Well, I’ve finished all the slides, now I need to work on my script.” “You fool!” I wanted to shout. “You’ve done it backwards! Throw it away and start all over again!” Then I pictured myself throwing her laptop across the room, adjusting my beret, and storming out as she gazed in stunned silence at her ruined computer.

Well, imaginary artistic hissy fit aside, I did tell her that she was doing things backwards. Most creative endeavors start with rough drafts and/or sketches. You use these to build a solid idea then work through a number of changes before arriving at a finished product. Think of an artist’s sketchbook, a reporter scribbling notes, a photographer taking test shots with a portable phone, or a songwriter noodling around on a piano trying out different melodies.

“What does this have to do with PowerPoint?” you’re probably wondering. It has everything to do with PowerPoint, because with forethought, planning, and creativity you can make each deck a strong part of your company’s marketing mix. If you start from the ground up, you can make decks that do a better job of communicating your messages. If you start with the design first and develop the message afterwards, then to quote Foghorn Leghorn, “You’re doin’ it all wrong, boy!”

Start with an outline

An outline is a great tool for getting your thoughts in order, organizing them into a logical progression, and exploring ideas. It’s how I started every paper I ever wrote for school, and it’s how I start all of my PowerPoint presentations to this day. You can create the outline right in PowerPoint, either in the Outline view or right on the slide.

All of what you’re trying to say — the facts, your story arc, examples, whatever — goes into the outline. Think of the outline as the core dump of your brain.

Now, a lot of folks do that then say “Done!”, slap their laptops shut, and call it a day. Wrong wrong WRONG!

Now do the visuals

The outline is only the beginning. You don’t want to be the schlub who reads bullet point after bullet point to an increasingly bored audience, do you? Of course you don’t!

The outline goes into the Speaker Notes so that you can reference it to keep on script, but the slide is where the magic happens. The slide is where you add the photos, graphics, words, video, and charts that support your message.

Use the slide to do what words cannot. Choose images instead of descriptions, videos instead of still photography, graphs instead of tables, brief sentences instead of paragraphs.

And don’t forget that you as a presenter will be there to guide your audience along the path of knowledge that you lay out. Whether you are presenting live, using cloud technology like Brainshark, or conducting a webinar, you yourself are a very important part of your presentation. You are there to tell the audience what you want them to know; the PowerPoint deck supports you, not the other way around.

I don’t know if that woman took my advice. It must have seemed harsh since she’d spent so much time on the slides by the time she called me. I wish she’d called me at the very beginning so that I could have spared her hours of work. But at least she gave me the idea to write this post so that I could help you!

Your turn

Do you use an outline to form your presentation ideas? If not, what method do you use?


December Slide Makeover of the Month

December 23, 2011

This month’s slide comes from a real presentation that a colleague of mine sat through. The image and text have been changed to protect the identity of the presenter, but it’s essentially the same slide from the deck.

Before

Before slide

Wow.

This slide has it all: a tiny title, densely packed text, misaligned bullet points, and an eensy-weensy little footer with today’s date and slide number. And the first line of text contains the same information as the title.

Mr. Smith has given us what amounts to an on-screen résumé that details his history and credentials. Does he expect the audience to read the slide from top to bottom while he silently stands by? No, because there is a script in the Speaker Notes. So when will the audience read this, if ever?Mr. Smith doesn’t need his own headshot on-screen because he’s standing right there in front of his audience!This makes him look like Citizen Kane, lecturing in front of his own super-enlarged image.There is entirely too much information on this slide, and I have the perfect solution.

After

blank

blank

That’s right; I’ve eliminated this slide completely.

This presentation was given to a group of his peers, live, at their place of business. Mr. Smith has already been vetted by the people who invited him to speak, so there’s no need to display his credentials in such minute detail. Of course, Mr. Smith could touch on his career highlights when he introduces himself at the beginning of his presentation, but there is no need to go into this level of detail.

On the other hand, if this had been presented as a Webinar, showing a photo of the presenter could build rapport. Here’s a redesigned slide for that purpose:

After slide

While this slide is on screen, Mr. Smith could talk a little bit about his credentials. He could also include a link to the more detailed résumé at the end of the presentation.


Animation in PowerPoint: too cool or too much?

December 22, 2011

After presenting my Cheating Death by PowerPoint workshop, I often ask people how they liked the animation. They usually answer “What animation?” Rather than feel discouraged that all that work I put into my deck went unnoticed, I’m overjoyed that the animation was so seamlessly integrated into the presentation that people didn’t even know it was there. For that, Grasshopper, is the secret of PowerPoint animation: use it if it helps to convey your message; avoid it if it becomes the message.

Transitions

Transitions are the animations that occur when you advance the slides in a deck. Change the transitions by highlighting slides in the left sidebar of the Normal View or in the Slide Sorter View then clicking on the appropriate effect in the Transitions ribbon:

PowerPoint transitions ribbon

Ordinarily, I’ll select Fade as the standard transition for an entire deck because it’s less jarring than None and Cut and doesn’t call attention to itself. But PowerPoint 2010 tempts the unwitting presentation designer with some pretty out-there transitions, such as Glitter, Vortex, and Cube. These can be used to great effect if you are creating an online presentation or a video but hugely distracting if the deck is being used by a presenter in front of an audience. Use your common sense. If you’re presenting to a bunch of geeks at Comic-Con then maybe the more flamboyant effects would be appropriate. If, on the other hand, you’re teaching Socratic reasoning at a university, then you probably want to exercise a little restraint.

You might notice that on the right side of the Transitions ribbon is a place where you can specify a sound effect for the transition. For the love of all that’s holy, don’t use sound effects for every slide transition. Your audience will hate you. A lot.

Animation

There are too many animation effects to go into great detail in a blog, but I did want to touch on a couple of highlights.

Fade

As with transitions, Fade is a good choice for animating things without calling too much attention to the effect. I use this when clients want bullet points to appear (if I’ve been unable to convince them to eliminate their bullet points) or when graphic elements appear in a sequence. Check out this animation sample:

In the first example, the elements fade into view, allowing you to read what’s in the box. The “Grow and Turn” and “Bounce” effects in the second example are distracting and unpredictable and so call too much attention to themselves.

Motion Paths

As the name implies, Motion Paths enable you to create an animation where elements follow a path that you create. The only preset paths I use are Lines, because I’ve never found a reason to use paths such as Trapezoid, Curvy Right, or Football. Here’s an example of motion paths in use:

As you can see, you can portray either realistic motion (the first example) or random, spazzy motion (the second example). Choose what’s right to communicate your message.

Wipe

The Wipe effect is great for comparing data in a chart because you can have data seem to grow or shrink. Here’s what I mean:

At first, the numbers seem OK, but then the red bars zoom up, showing that nearly half of all customers are dissatisfied. After the red bars grow, the statements appear. In this case, the Zoom effect for the first statement creates a sense of urgency.

Less is More

As I stated in a previous blog post, less really is more. Or, in the case of animation, the appearance of less. Make your PowerPoint animations as complicated or as simple as they need to be in order to effectively communicate your message. Don’t choose a Transition or Animation effect because it’s cool, choose it because it helps you to tell your story.

Your Turn

Do you use animation in your slide presentations and has anybody ever commented on it? Or, as an audience member, has any presenter you’ve seen included animation effects that you didn’t like or that distracted you?


Slide numbering in PowerPoint is stupid. Discuss.

December 7, 2011

boring slide numberingMore often than not, people ask me to include slide numbers on their decks. Maybe it makes them feel like they’re accomplishing something if they glance at the screen and see that they’re on slide 92, I don’t know. But putting slide numbers on your decks is a holdover from the last century and if you do it you should stop immediately! Why? Consider the following:

  • PowerPoint is not a print medium. How many times have you watched TV and seen a counter ticking down the minutes until the end of the program? Answer: never. Since PowerPoint is primarily a visual, on-screen medium, calling attention to the passage of time by including sequential slide numbering is pointless. To the audience, PowerPoint presentations are measured in the length of time it takes to deliver them, not the number of slides they contain.
  • Animations can inflate the size of the deck. It is often easier to break animations across a series of slides so that elements can be edited easily. To the audience it looks exactly the same as if everything’s on the same slide…except if the slides are numbered. In this case, slide numbers can be confusing (“How did we start on slide 3 and end up on slide 10? Did I miss something?”).
  • Slide numbering is distracting. How would you feel if you were at a presentation when suddenly you noticed that the speaker was on slide 110? Would you think “Boy, this presenter sure has a lot of knowledge to impart!” or “Holy cow, 110 slides? How much more of this do I have to endure?” By numbering slides, you bring your audience out of the moment and give them an opportunity to speculate on how many slides they’ve seen and how many are yet to come. Don’t distract your audience (Squirrel!); allow them to focus on the most important part of your presentation: you.
  • PowerPoint already keeps track of slide numbering. All slides in a PowerPoint deck are numbered in the Outline, Slide Sorter, and Notes views. So my clients can tell me “Please change the image on slide 5” and I know exactly where to go in the document.

So if slide numbering detracts from visual, kinetic storytelling, makes it look as though the audience might have missed something, is distracting, and doesn’t help during editing, why do it?

Your turn

You know where I stand on slide numbering, now I’d like to hear from you. Do you number your slides? Why or why not?